Visit the video to navigate using timestamps in the description or bookmarks in the progress bar.
(00:00) Introduction
(00:57) My Background
(02:03) Teaching R & Connection to Course
(04:10) What I’m Excited About!
The R Toolkit
Introducing R
R is a 30-year-old statistical language created by New Zealand statisticians Robert Gentleman and Ross Ihaka as a free alternative to proprietary software for their students at the University of Auckland. In fact, its rich lineage can be directly traced to inventor and scientist Alexander Graham Bell.
Watch the video below for a brief introduction to R as it’s used today.
The R Toolkit
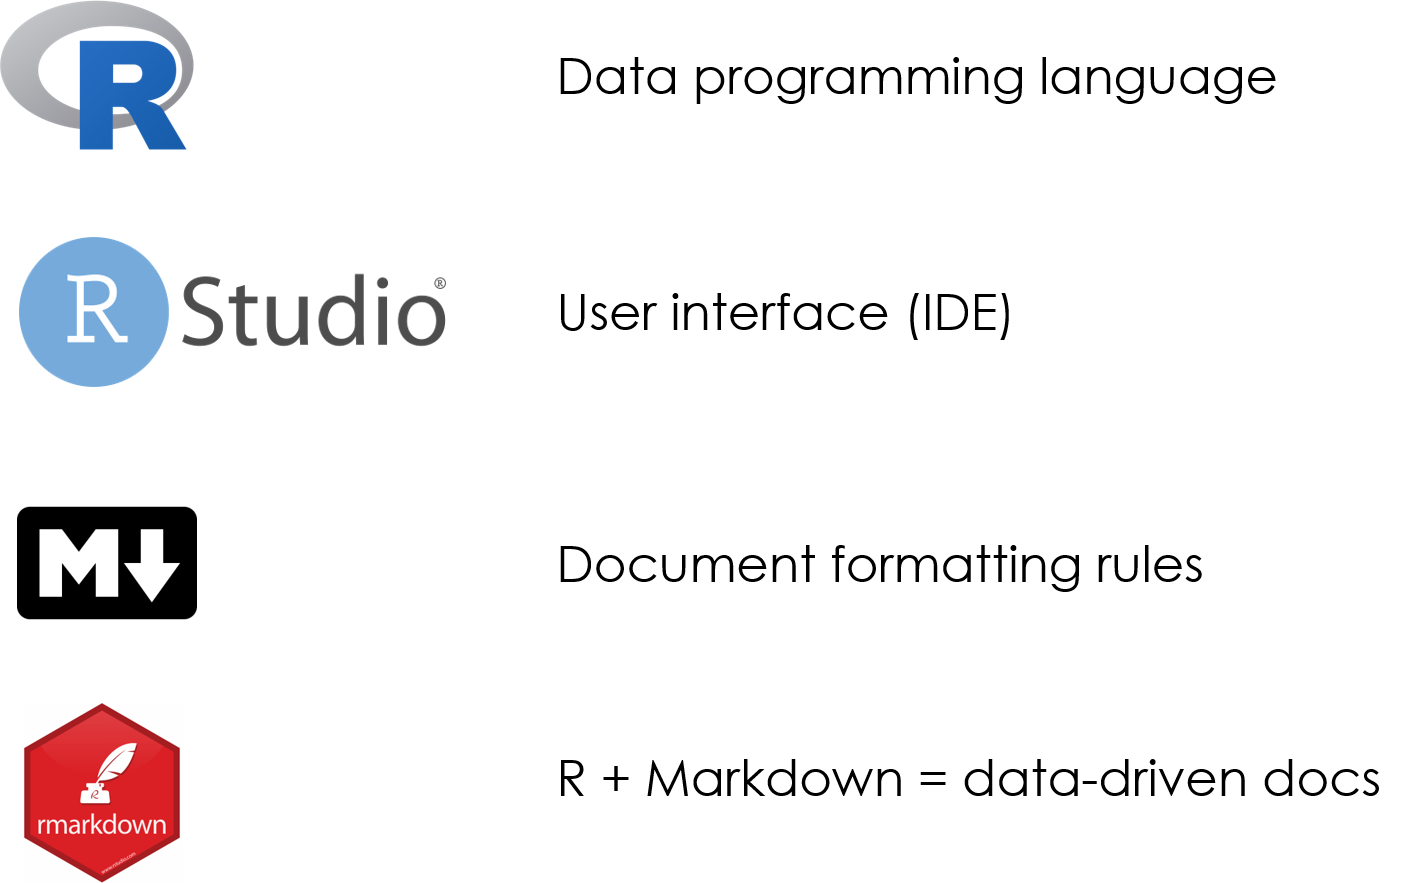
In this course we cover the foundations of data programming with the R language. In order to create robust and dynamic analysis we need to use a couple of tools that were built to leverage the power of R and create compelling narratives.
RStudio helps you manage projects by organizing files, scripts, packages and output. Markdown is a simple formatting convention that allows you to create publication-quality documents. R Markdown is a specific version of Markdown that allows you to combine text and code to create data-driven documents.
The following resources will help you get a better understanding of these tools.
RStudio is a graphical user interface (GUI) and integrated developer environment (IDE) that makes it much easier to use R for writing code, importing data, installing packages, and other features.
RStudio: A Guided Tour
The following video provides a tour of the RStudio interface and key components for getting started.
What is RStudio?
Executing and scripting commands
Point-and-click and keyboard shorcuts
Major interface components and features
Visit the video to navigate using timestamps in the description or bookmarks in the progress bar.
(00:00) Introduction & Defining Integrated Development Environments (IDE)
(00:41) The Five Key Components of RStudio
(02:17) Using the Console vs. Using Scripts
(04:29) Shortcuts: Jumping Around, Full Screen, Saving
(05:27) How to Save an R Script
(06:36) Shortcuts: Moving Between & Exiting Scripts
(07:19) “Session” & Setting Working Directories
(08:07) Exporting Data as CSV Files
(09:04) “Tools” & Customizing Your RStudio Interface
(10:02) “Help” & Accessing Cheat Sheets
(10:42) Global Environment & Objects
(13:20) RStudio’s Data Import Wizard
(14:35) “Files” & Directory Contents
(14:57) “Plots” & Graphics in R
(15:44) “Help” & Documentation
(17:01) Conclusions
Easy Formatting with Markdown
Markdown is a “lightweight”, easy-to-learn syntax that allows you to format language with boldface, italicization, bullet points, and more, even when there’s no “rich content editor” menu available.
Websites and applications that support Markdown may surprise you, including:
Reddit
GitHub
RStudio
OpenStreetMap
Stack Exchange
Microsoft Teams
Markdown Basics
The following video provides a brief introduction to Markdown fundamentals.
Headers & Sub-Headers
Boldface & Italicization
Ordered & Unordered Lists
List Sub-Items & Hyperlinks
Visit the video to navigate using timestamps in the description or bookmarks in the progress bar.
(00:00) What Is Markdown?
(01:17) Demonstrating Markdown in RStudio
(02:00) Typing Human-Readable Language
(02:27) Creating Headers
(02:57) Creating Sub-Headers
(04:35) Formatting Boldface & Italicization
(05:58) Creating Unordered & Ordered Lists
(07:04) Creating List Sub-Items
(08:23) Formatting Hyperlinks
(09:38) Conclusion
Understanding GitHub Issues
GitHub Issues allow you to quickly troubleshoot issues with instructors and peers by sharing code, reproducing errors, and thoroughly explaining complications as you learn R.
GitHub Issues: A Tutorial
The following video provides a tutorial for using GitHub Issues.
Locating the Issues page
Exploring previously posted Issues
Creating, labeling, and assigning collaborators
Visit the video to navigate using timestamps in the description or bookmarks in the progress bar.
(00:00) Introduction
(00:55) Getting to the Issues Page: A Shortcut
(01:42) The Issues Page
(02:08) Exploring Posted Issues
(02:40) Viewing an Example Issue
(03:24) Recommended: Browse Issues Before Posting
(03:46) Creating a New Issue: The Title
(04:18) Labeling Issues & Assigning Collaborators
(04:46) The Body Text: Explaining Your Issue
(05:45) Examples of Best Practices
(06:19) Formatting with Markdown
(07:15) Conclusion
What Is R Markdown?
R Markdown is one of the most powerful tools you’ll learn. It allows the synthesis of human language and code to perform processing and analysis tasks while explaining them to broad audiences.
R Markdown: An Introduction
The following video provides a tutorial and demonstration of R Markdown.
Locating Lab Assignment Templates
Creating New R Markdown Files
The Benefits of R Markdown
Customizing & Compiling
Completing Assignments
Visit the video to navigate using timestamps in the description or bookmarks in the progress bar.
(00:00) Introduction & Contents
(00:22) Locating R Markdown Templates
(01:20) Creating a New R Markdown File
(02:36) Machine- & Human-Readable Code
(05:41) Creating & Formatting from Scratch
(06:19) Creating Code Chunks
(07:37) Code Chunk Options
(09:55) Lab Templates
(12:25) Discussion
Getting Help
Understand Your Resources
Data analytics is a very social endeavor and real-world analytics projects are almost always collaborative.
These courses are designed to be interactive, and a lot of learning occurs by practicing the technical jargon from the field and learning how to talk about data and models.
Learning how to seek help and use discussion boards will accelerate learning and facilitate collaboration. Social coding tools like GitHub use these features extensively.
We are going to throw a lot at you, but also provide a lot of support. Over these first couple of weeks feel free to reach out for anything you might need.
Troubleshooting & Clarification
If you find something confusing, let us know (likely others will find it confusing as well).
Schedule a Zoom call with your instructor and screen share to walk through issues
Request a walk-through and your instructor will provide examples and steps
As a general rule of thumb, if you are stuck on the math or code for a problem, need clarification about what the question is asking, want to make sure you understand a formula, or are having similar issues then the help discussion page is the easiest and quickest way to get help. If you are confused about concepts or having a hard time even formulating your question, then virtual office hours are your best option.
Note that the discussion board is hosted by the GitHub issues feature. It is a great forum because:
You can format code and math using standard markdown syntax.
You can cut and paste images directly into the message.
You can direction responses using @username mentions.
Please preview your responses before posting to ensure proper formatting. Note that you format code by placing fences around the code:
```
# your code here
lm( y ~ x1 + x2 )
```
The fences are made of three back-ticks. These look like quotation marks, but are actually the character at the top left of your keyboard (if you have a US or European keyboard) and shared with the tilde (~).
```
y = b0 + b1•X1 + b2•X2 + e

b1 = cov(x,y) / var(x)
```
Checklist
Getting Started
The following checklist will help you organize and prepare for success in this course.
This unit introduces the most fundamental building blocks of data programming in R.
Vectors are one or more values of the same type - each column in a table is a vector
Functions are defined operations that transform individual or summarize multiple values
Objects are named representations of values, datasets, functions, and other information
Assignment is the act of naming and creating an object
Learning Objectives
Once you have completed this unit, you will be able to:
Create new objects with assignment
Understand the basic anatomy and application of functions
Summarize vectors of various classes e.g. numeric, character, and logical
Lab Assignment
Lab-01 is your first opportunity to combine human language and R code in R Markdown. You will practice using tax parcel data from Syracuse, NY (USA), including:
Summarizing dataset characteristics, e.g. dimensions
Use arithmetic functions to summarize and average data
Determine the number of occurrences of qualitative data
Functions
This assignment requires some combination of the following functions and operators:
names(): Returns the variable names of a dataset
head(): Returns the initial values of a dataset; default is 6 rows
$: Extracts a variable from a dataset using data$variable syntax
length(): Returnes the total number of values in a vector
dim(): Returns the total rows and columns of a dataset, respectively
nrow(): Returns the total rows of a dataset
ncol(): Returns the total columns of a dataset
sum(): Returns the sum of:
All values in a numeric vector
Total TRUE values of a logical vector
summary(): Returns summary statistics for a dataset or individual vectors
table(): Returns a tally of the number of occurences of unique values in a vector
Practice Data
This assignement uses Downtown Syracuse tax parcel data. View the documentation here.
The world is simultaneously generating more data than it has ever before, as well as pushing for policies for making government data more accessible and democratic. These trends and movements is an important enabling aspect of data science, becuse it provides opportunity for real insights that can change our understanding of systems and allow us to hold institutions accountable.
So ignoring potential problems with big and open data for now, read about two interesting cases where big and open data have offered deep insights into city planning and human nature.
“A Data Analyst’s Blog Is Transforming How New Yorkers See Their City”, NPR, Nov 2018.
For your discussion topic this week, find one data-driven blog post from Ben Wellington’s I Quant NY and/or OK Cupid’s OK Trends where you discovered something cool that you did not know, and share it with the group. In your post highlight what is interesting about the example, and what data made it possible.
Please post your reflection as a new pin on YellowDig.
You can also check out Ben’s Ted Talk, or this short interview.
Note: You get points on Yellowdig by interacting with content. That means creating new posts and participating in posts that your classmates create. Your Yellowdig posts are due on Friday, but you gain points throughout the week by participating in discussions.
You can earn up to 20 points a week, and points reset on Fridays. You need to earn 100 points throughout the seven-week term, which means averaging 15 points a week.
FRI Jan 15th
Lab 01
Lab-01 - Practice with Vectors
This lab is designed to introduce you to basic functions that explore datasets and variables.
Nobody tells this to people who are beginners, and I really wish somebody had told this to me.
All of us who do creative work, we get into it because we have good taste. But it’s like there is this gap. For the first couple years that you’re making stuff, what you’re making isn’t so good. It’s not that great. It’s trying to be good, it has ambition to be good, but it’s not that good.
But your taste, the thing that got you into the game, is still killer. And your taste is good enough that you can tell that what you’re making is kind of a disappointment to you. A lot of people never get past that phase. They quit.
Everybody I know who does interesting, creative work they went through years where they had really good taste and they could tell that what they were making wasn’t as good as they wanted it to be. They knew it fell short. Everybody goes through that.
And if you are just starting out or if you are still in this phase, you gotta know its normal and the most important thing you can do is do a lot of work. Do a huge volume of work. Put yourself on a deadline so that every week or every month you know you’re going to finish one story. It is only by going through a volume of work that you’re going to catch up and close that gap. And the work you’re making will be as good as your ambitions.
I took longer to figure out how to do this than anyone I’ve ever met. It takes awhile. It’s gonna take you a while. It’s normal to take a while. You just have to fight your way through that.
It’s easy when you start out programming to get really frustrated and think, “Oh it’s me, I’m really stupid,” or, “I’m not made out to program.” But, that is absolutely not the case. Everyone gets frustrated. I still get frustrated occasionally when writing R code. It’s just a natural part of programming. So, it happens to everyone and gets less and less over time. Don’t blame yourself. Just take a break, do something fun, and then come back and try again later.
But what is R, and what are the nerds cool kids using it for?
This week, your task is to explore a few blogs about tools in R and find one package or application that you are excited about. It can be an analytics package, a graphics package, a specific application, or a tutorial on a topic that interests you. I don’t expect you use of understand the package or tutorial, rather just identify a tool that would be useful given your interests.
Mine, personally, was the package that allows you to create comic strip graphics in R:
Take note, this assignment asks you to explore a new community where the technical language is unfamiliar and the volume of information vast. There are currently over 15,000 packages available in R! Part of the goal of the assignment is to recognize the sheer volume of creativity in the R community and the scope of work that can be done with the language. But the immediate learning objective is to find some sources that make the content accessible. Here are a few to get you started:
You will need a basic understanding of constructing groups and subsets in these sections.
Logical Operators (1.1)
Selector Vectors (1.2)
Usefulness of Selector Vectors (1.3)
Compound Logical Statements (2.1)
The Opposite-Of Operator (2.2)
The rest of the chapter is useful information to come back to, but not needed for the lab.
Similar to last week, the chapter highlights some easy ways to make errors with your code. We don’t want to convince you that R is hard, but rather to ensure that you are paying attention to some subtle features of machine language that can impact your data.
People naturally go through a few phases. When you start out, you don’t have many tips and techniques at your disposal. So, you are forced to do the simplest thing possible using the simplest ideas. And sometimes you face problems that are really hard to solve, because you don’t know quite the right techniques yet. So, the very earliest phase, you’ve got a few techniques that you understand really well, and you apply them everywhere because those are the techniques you know.
And the next stage that a lot of people go through, is that you learn more techniques, and more complex ways of solving problems, and then you get excited about them and start to apply them everywhere possible. So instead of using the simplest possible solution, you end up creating something that’s probably overly complex or uses some overly general formulation.
And then eventually you get past that and it’s about understanding, “what are the techniques at my disposal? Which techniques fit this problem most naturally? How can I express myself as clearly as possible, so I can understand what I am doing, and so other people can understand what I am doing?” I talk about this a lot but think explicitly about code as communication. You are obviously telling the computer what to do, but ideally you want to write code to express what it means or what it is trying to do as well, so when others read it and when you in the future reads it, you can understand some of the reasoning.
This section introduces the Core R graphics engine.
Learning Objectives
Once you have completed this section you will be able to:
Use the plot() function
Build custom graphics with base graphing commands:
points()
lines(), abline()
text()
axis()
Assigned Reading
Required:
Please skim these chapters before starting your lab. Sample code has been provided for each lab question, but you may need the chapters and the R help files to find specific arguments.
This week you will begin working in the core R graphics engine. This discussion topic offers an opportunity to explore some of the myriad graphics packages in R.
Your task is to select a specialized graphic that you could use in your own (hypothetical) research or professional life, then describe what data or topic from your own work the visualization would be useful for. Reference the R package you would need for the task.
For example, I might say that I work creating budgets for a government organization. I could use a Sankey Diagram from the D3 Package to visualize our budget.
Code is provided to get you started, but you will have to use documentation and the web to push the boundaries of your new knowledge of these functions.
There is a lot of science behind data visualization, but the art to storytelling with data can be hard to distill into a few basic principles. As a result, it takes time to learn how to do it well. The best way to develop data visualization skill is to regularly consume interesting graphics. David McCandless is one of the best ambassadors for the field of graphic design and visualization. Check out his TED Talk, and some excerpts from his book Information is Beautiful.
Unfortunately, it is much easier to create tragically bad graphics than it is to create good graphics. For your blog this week, read the Calling Bullshit overview on proportional ink and misleading axes to develop some sensitivity about misleading graphics.
Find a graph that violates one of these principles, or commits an equally egregious visualization crime. Share the graph and explain what offense has been committed. You might start by searching for “bad graphs” on google images.
This unit focuses on the important task of “data wrangling”, various manipulations that allow you to quickly filter, join, sort, transform, and describe your data. The dplyr package and tidyverse tools are some of the most popular in R.
Learning Objectives
By the end of this unit you will be able to:
Subset data by rows or columns
Create multi-dimensional summary tables by grouping data
Generate new variables through transformations of existing variables
Write efficient “data recipes” using pipe operators
Part of the reason data science has grown so much as a field in recent years is because of advances in computing technologies that allows us to run powerful programs and to work with large datasets on personal computers. But just as important, data has become so ubiquitous, cheap, and valuable for organizations.
Your skill level in data science can be measured by how quickly you can take a real-world problem and produce analysis that offers better solutions than the status quo. Analyzing the data is important, but the process of obtaining data is not a trivial step. Having knowledge about where to look for data, or how to augment your existing data, will help you be more effective as an analyst.
Next week we will discuss some ways to get data into R. You can always download data from a website in its current format (CSV, SPSS, or Stata, etc.) then import it into R. Alternatively, it is typically more efficient to use an API.
API stands for “Application Programming Interface”, which is computer science jargon for the protocols that allow two applications to speak to each other. If you are using your mobile phone and you want to log into your bank using an app, an API will send your user credential and password to your bank, and will return information about your balances and transactions. In other words, APIs are structured ways of sending requests back and fourth between systems. The provide permission for external users to query some parts of internal databases (e.g. what is my checking account balance?), and control what information will be returned.
In some cases, organizations that host public datasets have created data APIs to make it easier to request and share the data. To see some examples visit the Data Science Toolkit website, and test out some APIs. In some cases you give some search parameters (such as a zip code), and it returns a new dataset (census data). In other cases, you send data (raw text), and the API sends you a processed version of the data (a sentiment score based upon words in the text). Thus APIs can be used both to access new data sources, as well as to clean or process your current data as part of your project.
The R community has made a lot of APIs easier to use by creating packages that allow you to access data directly in R using custom functions. For example, the Twitter package allows you to request tweets from specific dates and users, and sends back a dataset of all tweets that meet your criteria (with limits on how much you can access at a time).
R packages translate the API into functions that will translate your request into the correct API format, send the request, return the data directly into R, and often convert it into an easy to use format like a data frame. In this way, you can quickly access thousands of datasets in real time through R, and you can also store your requests in scripts for future use.
For the discussion topic this week find an example of an API that could be useful for your work. For example, I use a lot of federal data. I was excited to learn that the website Data USA has created a public API that allows users to access over a dozen federal datasets:
You can find APIs through a Google search, or browse datasets on the DS4PS Open Data page. Altnernatively, you can report on a package in R that uses a data API and describe what kinds of data the package allows you to access.
Note, you do not have to show how to use the API for the post, just identify what information is accessible and how it might be used.
This week has you continue practicing “data wrangling”. This week will add the step of joining multiple datasets prior to analysis. We will continue to use the dplyr package.
Learning Objectives
By the end of this unit you will be able to:
Merge two related datasets using join functions
Identify appropriate keys for joins
Determine whether you need an inner, outer, or full join
We will join the Salaries table to player bios (Master table) and performance data (Batting and Fielding) to assess which characteristics predict salary and which teams have been able to most efficiently convert salary to wins.
Hear me out. The government is just one big open-source project.
Except currently the source code is only edited irregularly by one giant team, and they debate every single change, and then vote on it.
The code is now millions of lines long, and most of it doesn’t do what it was originally designed for, but it is too exhausting to make changes so they just leave it. There are lots of bugs, and many features do not work.
Despite the flaws, the code somehow still functions (albeit very slowly now, like really slow), and the fan is making funny noises, and sometimes we get a blue screen during the budget process and it shuts down for a few weeks. But when it is re-started, it still kinda works.
It’s an imperfect metaphor, but many people have theorized that government can learn a lot from how open source projects are managed (or governed if we are being precise).
Ben Balter wants to get all up in the U.S. government’s code, and he thinks you should be able to as well. Balter, a Washington, D.C.-based lawyer, is GitHub’s official Government Evangelist. His purpose: to educate government agencies about adopting open-source software.
My favorite Ben Balter project was something simple. GIS files are notoriously large and hard to work with (for some reason GIS shapefiles still split data into five separate files that you have to keep together for them to work properly).
The open source community has created some better data structures that are more efficient and easier to share (geoJSON files), but the geographers that work for cities were all trained on ArcGIS products so it’s all they know! Ben wrote a script that downloaded all of Washington DC’s open data files, converted them to better formats, then uploaded them to GitHub so others have access.
https://github.com/benbalter/dc-maps
It might seem trivial - but geoJSON files can be read into R directly from GitHub, making it easy to deploy the data for a wide variety of purposes:
Do you think open source frameworks would help open the black box and make government more accessible? Would government become more accessible, or alienate regular citizens that are not computer scientists? Would it make influence from special interests more transparent, or would it make it easier for them to hijack the process of shaping local laws?
“With very few exceptions, there is no shortcut between not knowing something and knowing it. There is a beauty to awkwardness, a wisdom in the wobble.”
~Maya Stein
Checklist
Your Final Week
The following checklist will help you stay organized for your final week.
Since you are sharing your code-through with your classmates on Yellowdig, it will serve as your discussion topic this week.
If you send me your RMD and HTML files via email, I will post them to GitHub and create a link for you if you would like to share a URL instead of a file.
Working with the crash data from Lab-05, you will extend the work you began in Lab-04 by building on a dynamic data dashboard that will be used to explore and reveal insights in Tempe crash data.
Visit the video to navigate using timestamps in the description or bookmarks in the progress bar.
(00:00) Introduction
(00:57) My Background
(02:03) Teaching R & Connection to Course
(04:10) What I’m Excited About!
Introducing R
R is a 30-year-old statistical language created by New Zealand statisticians Robert Gentleman and Ross Ihaka as a free alternative to proprietary software for their students at the University of Auckland. In fact, its rich lineage can be directly traced to inventor and scientist Alexander Graham Bell.
Watch the video below for a brief introduction to R as it’s used today.
The R Toolkit
In this course we cover the foundations of data programming with the R language. In order to create robust and dynamic analysis we need to use a couple of tools that were built to leverage the power of R and create compelling narratives.
RStudio helps you manage projects by organizing files, scripts, packages and output. Markdown is a simple formatting convention that allows you to create publication-quality documents. R Markdown is a specific version of Markdown that allows you to combine text and code to create data-driven documents.
The following resources will help you get a better understanding of these tools.
RStudio is a graphical user interface (GUI) and integrated developer environment (IDE) that makes it much easier to use R for writing code, importing data, installing packages, and other features.
RStudio: A Guided Tour
The following video provides a tour of the RStudio interface and key components for getting started.
What is RStudio?
Executing and scripting commands
Point-and-click and keyboard shorcuts
Major interface components and features
Visit the video to navigate using timestamps in the description or bookmarks in the progress bar.
(00:00) Introduction & Defining Integrated Development Environments (IDE)
(00:41) The Five Key Components of RStudio
(02:17) Using the Console vs. Using Scripts
(04:29) Shortcuts: Jumping Around, Full Screen, Saving
(05:27) How to Save an R Script
(06:36) Shortcuts: Moving Between & Exiting Scripts
(07:19) “Session” & Setting Working Directories
(08:07) Exporting Data as CSV Files
(09:04) “Tools” & Customizing Your RStudio Interface
(10:02) “Help” & Accessing Cheat Sheets
(10:42) Global Environment & Objects
(13:20) RStudio’s Data Import Wizard
(14:35) “Files” & Directory Contents
(14:57) “Plots” & Graphics in R
(15:44) “Help” & Documentation
(17:01) Conclusions
Easy Formatting with Markdown
Markdown is a “lightweight”, easy-to-learn syntax that allows you to format language with boldface, italicization, bullet points, and more, even when there’s no “rich content editor” menu available.
Websites and applications that support Markdown may surprise you, including:
Reddit
GitHub
RStudio
OpenStreetMap
Stack Exchange
Microsoft Teams
Markdown Basics
The following video provides a brief introduction to Markdown fundamentals.
Headers & Sub-Headers
Boldface & Italicization
Ordered & Unordered Lists
List Sub-Items & Hyperlinks
Visit the video to navigate using timestamps in the description or bookmarks in the progress bar.
(00:00) What Is Markdown?
(01:17) Demonstrating Markdown in RStudio
(02:00) Typing Human-Readable Language
(02:27) Creating Headers
(02:57) Creating Sub-Headers
(04:35) Formatting Boldface & Italicization
(05:58) Creating Unordered & Ordered Lists
(07:04) Creating List Sub-Items
(08:23) Formatting Hyperlinks
(09:38) Conclusion
Understanding GitHub Issues
GitHub Issues allow you to quickly troubleshoot issues with instructors and peers by sharing code, reproducing errors, and thoroughly explaining complications as you learn R.
GitHub Issues: A Tutorial
The following video provides a tutorial for using GitHub Issues.
Locating the Issues page
Exploring previously posted Issues
Creating, labeling, and assigning collaborators
Visit the video to navigate using timestamps in the description or bookmarks in the progress bar.
(00:00) Introduction
(00:55) Getting to the Issues Page: A Shortcut
(01:42) The Issues Page
(02:08) Exploring Posted Issues
(02:40) Viewing an Example Issue
(03:24) Recommended: Browse Issues Before Posting
(03:46) Creating a New Issue: The Title
(04:18) Labeling Issues & Assigning Collaborators
(04:46) The Body Text: Explaining Your Issue
(05:45) Examples of Best Practices
(06:19) Formatting with Markdown
(07:15) Conclusion
What Is R Markdown?
R Markdown is one of the most powerful tools you’ll learn. It allows the synthesis of human language and code to perform processing and analysis tasks while explaining them to broad audiences.
R Markdown: An Introduction
The following video provides a tutorial and demonstration of R Markdown.
Locating Lab Assignment Templates
Creating New R Markdown Files
The Benefits of R Markdown
Customizing & Compiling
Completing Assignments
Visit the video to navigate using timestamps in the description or bookmarks in the progress bar.
(00:00) Introduction & Contents
(00:22) Locating R Markdown Templates
(01:20) Creating a New R Markdown File
(02:36) Machine- & Human-Readable Code
(05:41) Creating & Formatting from Scratch
(06:19) Creating Code Chunks
(07:37) Code Chunk Options
(09:55) Lab Templates
(12:25) Discussion
Understand Your Resources
Data analytics is a very social endeavor and real-world analytics projects are almost always collaborative.
These courses are designed to be interactive, and a lot of learning occurs by practicing the technical jargon from the field and learning how to talk about data and models.
Learning how to seek help and use discussion boards will accelerate learning and facilitate collaboration. Social coding tools like GitHub use these features extensively.
We are going to throw a lot at you, but also provide a lot of support. Over these first couple of weeks feel free to reach out for anything you might need.
Troubleshooting & Clarification
If you find something confusing, let us know (likely others will find it confusing as well).
Schedule a Zoom call with your instructor and screen share to walk through issues
Request a walk-through and your instructor will provide examples and steps
As a general rule of thumb, if you are stuck on the math or code for a problem, need clarification about what the question is asking, want to make sure you understand a formula, or are having similar issues then the help discussion page is the easiest and quickest way to get help. If you are confused about concepts or having a hard time even formulating your question, then virtual office hours are your best option.
Note that the discussion board is hosted by the GitHub issues feature. It is a great forum because:
You can format code and math using standard markdown syntax.
You can cut and paste images directly into the message.
You can direction responses using @username mentions.
Please preview your responses before posting to ensure proper formatting. Note that you format code by placing fences around the code:
```
# your code here
lm( y ~ x1 + x2 )
```
The fences are made of three back-ticks. These look like quotation marks, but are actually the character at the top left of your keyboard (if you have a US or European keyboard) and shared with the tilde (~).
```
y = b0 + b1•X1 + b2•X2 + e

b1 = cov(x,y) / var(x)
```
Getting Started
The following checklist will help you organize and prepare for success in this course.
This unit introduces the most fundamental building blocks of data programming in R.
Vectors are one or more values of the same type - each column in a table is a vector
Functions are defined operations that transform individual or summarize multiple values
Objects are named representations of values, datasets, functions, and other information
Assignment is the act of naming and creating an object
Learning Objectives
Once you have completed this unit, you will be able to:
Create new objects with assignment
Understand the basic anatomy and application of functions
Summarize vectors of various classes e.g. numeric, character, and logical
Lab Assignment
Lab-01 is your first opportunity to combine human language and R code in R Markdown. You will practice using tax parcel data from Syracuse, NY (USA), including:
Summarizing dataset characteristics, e.g. dimensions
Use arithmetic functions to summarize and average data
Determine the number of occurrences of qualitative data
Functions
This assignment requires some combination of the following functions and operators:
names(): Returns the variable names of a dataset
head(): Returns the initial values of a dataset; default is 6 rows
$: Extracts a variable from a dataset using data$variable syntax
length(): Returnes the total number of values in a vector
dim(): Returns the total rows and columns of a dataset, respectively
nrow(): Returns the total rows of a dataset
ncol(): Returns the total columns of a dataset
sum(): Returns the sum of:
All values in a numeric vector
Total TRUE values of a logical vector
summary(): Returns summary statistics for a dataset or individual vectors
table(): Returns a tally of the number of occurences of unique values in a vector
Practice Data
This assignement uses Downtown Syracuse tax parcel data. View the documentation here.
The world is simultaneously generating more data than it has ever before, as well as pushing for policies for making government data more accessible and democratic. These trends and movements is an important enabling aspect of data science, becuse it provides opportunity for real insights that can change our understanding of systems and allow us to hold institutions accountable.
So ignoring potential problems with big and open data for now, read about two interesting cases where big and open data have offered deep insights into city planning and human nature.
“A Data Analyst’s Blog Is Transforming How New Yorkers See Their City”, NPR, Nov 2018.
For your discussion topic this week, find one data-driven blog post from Ben Wellington’s I Quant NY and/or OK Cupid’s OK Trends where you discovered something cool that you did not know, and share it with the group. In your post highlight what is interesting about the example, and what data made it possible.
Please post your reflection as a new pin on YellowDig.
You can also check out Ben’s Ted Talk, or this short interview.
Note: You get points on Yellowdig by interacting with content. That means creating new posts and participating in posts that your classmates create. Your Yellowdig posts are due on Friday, but you gain points throughout the week by participating in discussions.
You can earn up to 20 points a week, and points reset on Fridays. You need to earn 100 points throughout the seven-week term, which means averaging 15 points a week.
Lab-01 - Practice with Vectors
This lab is designed to introduce you to basic functions that explore datasets and variables.
Nobody tells this to people who are beginners, and I really wish somebody had told this to me.
All of us who do creative work, we get into it because we have good taste. But it’s like there is this gap. For the first couple years that you’re making stuff, what you’re making isn’t so good. It’s not that great. It’s trying to be good, it has ambition to be good, but it’s not that good.
But your taste, the thing that got you into the game, is still killer. And your taste is good enough that you can tell that what you’re making is kind of a disappointment to you. A lot of people never get past that phase. They quit.
Everybody I know who does interesting, creative work they went through years where they had really good taste and they could tell that what they were making wasn’t as good as they wanted it to be. They knew it fell short. Everybody goes through that.
And if you are just starting out or if you are still in this phase, you gotta know its normal and the most important thing you can do is do a lot of work. Do a huge volume of work. Put yourself on a deadline so that every week or every month you know you’re going to finish one story. It is only by going through a volume of work that you’re going to catch up and close that gap. And the work you’re making will be as good as your ambitions.
I took longer to figure out how to do this than anyone I’ve ever met. It takes awhile. It’s gonna take you a while. It’s normal to take a while. You just have to fight your way through that.
It’s easy when you start out programming to get really frustrated and think, “Oh it’s me, I’m really stupid,” or, “I’m not made out to program.” But, that is absolutely not the case. Everyone gets frustrated. I still get frustrated occasionally when writing R code. It’s just a natural part of programming. So, it happens to everyone and gets less and less over time. Don’t blame yourself. Just take a break, do something fun, and then come back and try again later.
But what is R, and what are the nerds cool kids using it for?
This week, your task is to explore a few blogs about tools in R and find one package or application that you are excited about. It can be an analytics package, a graphics package, a specific application, or a tutorial on a topic that interests you. I don’t expect you use of understand the package or tutorial, rather just identify a tool that would be useful given your interests.
Mine, personally, was the package that allows you to create comic strip graphics in R:
Take note, this assignment asks you to explore a new community where the technical language is unfamiliar and the volume of information vast. There are currently over 15,000 packages available in R! Part of the goal of the assignment is to recognize the sheer volume of creativity in the R community and the scope of work that can be done with the language. But the immediate learning objective is to find some sources that make the content accessible. Here are a few to get you started:
You will need a basic understanding of constructing groups and subsets in these sections.
Logical Operators (1.1)
Selector Vectors (1.2)
Usefulness of Selector Vectors (1.3)
Compound Logical Statements (2.1)
The Opposite-Of Operator (2.2)
The rest of the chapter is useful information to come back to, but not needed for the lab.
Similar to last week, the chapter highlights some easy ways to make errors with your code. We don’t want to convince you that R is hard, but rather to ensure that you are paying attention to some subtle features of machine language that can impact your data.
People naturally go through a few phases. When you start out, you don’t have many tips and techniques at your disposal. So, you are forced to do the simplest thing possible using the simplest ideas. And sometimes you face problems that are really hard to solve, because you don’t know quite the right techniques yet. So, the very earliest phase, you’ve got a few techniques that you understand really well, and you apply them everywhere because those are the techniques you know.
And the next stage that a lot of people go through, is that you learn more techniques, and more complex ways of solving problems, and then you get excited about them and start to apply them everywhere possible. So instead of using the simplest possible solution, you end up creating something that’s probably overly complex or uses some overly general formulation.
And then eventually you get past that and it’s about understanding, “what are the techniques at my disposal? Which techniques fit this problem most naturally? How can I express myself as clearly as possible, so I can understand what I am doing, and so other people can understand what I am doing?” I talk about this a lot but think explicitly about code as communication. You are obviously telling the computer what to do, but ideally you want to write code to express what it means or what it is trying to do as well, so when others read it and when you in the future reads it, you can understand some of the reasoning.
This section introduces the Core R graphics engine.
Learning Objectives
Once you have completed this section you will be able to:
Use the plot() function
Build custom graphics with base graphing commands:
points()
lines(), abline()
text()
axis()
Assigned Reading
Required:
Please skim these chapters before starting your lab. Sample code has been provided for each lab question, but you may need the chapters and the R help files to find specific arguments.
This week you will begin working in the core R graphics engine. This discussion topic offers an opportunity to explore some of the myriad graphics packages in R.
Your task is to select a specialized graphic that you could use in your own (hypothetical) research or professional life, then describe what data or topic from your own work the visualization would be useful for. Reference the R package you would need for the task.
For example, I might say that I work creating budgets for a government organization. I could use a Sankey Diagram from the D3 Package to visualize our budget.
Code is provided to get you started, but you will have to use documentation and the web to push the boundaries of your new knowledge of these functions.
There is a lot of science behind data visualization, but the art to storytelling with data can be hard to distill into a few basic principles. As a result, it takes time to learn how to do it well. The best way to develop data visualization skill is to regularly consume interesting graphics. David McCandless is one of the best ambassadors for the field of graphic design and visualization. Check out his TED Talk, and some excerpts from his book Information is Beautiful.
Unfortunately, it is much easier to create tragically bad graphics than it is to create good graphics. For your blog this week, read the Calling Bullshit overview on proportional ink and misleading axes to develop some sensitivity about misleading graphics.
Find a graph that violates one of these principles, or commits an equally egregious visualization crime. Share the graph and explain what offense has been committed. You might start by searching for “bad graphs” on google images.
This unit focuses on the important task of “data wrangling”, various manipulations that allow you to quickly filter, join, sort, transform, and describe your data. The dplyr package and tidyverse tools are some of the most popular in R.
Learning Objectives
By the end of this unit you will be able to:
Subset data by rows or columns
Create multi-dimensional summary tables by grouping data
Generate new variables through transformations of existing variables
Write efficient “data recipes” using pipe operators
Part of the reason data science has grown so much as a field in recent years is because of advances in computing technologies that allows us to run powerful programs and to work with large datasets on personal computers. But just as important, data has become so ubiquitous, cheap, and valuable for organizations.
Your skill level in data science can be measured by how quickly you can take a real-world problem and produce analysis that offers better solutions than the status quo. Analyzing the data is important, but the process of obtaining data is not a trivial step. Having knowledge about where to look for data, or how to augment your existing data, will help you be more effective as an analyst.
Next week we will discuss some ways to get data into R. You can always download data from a website in its current format (CSV, SPSS, or Stata, etc.) then import it into R. Alternatively, it is typically more efficient to use an API.
API stands for “Application Programming Interface”, which is computer science jargon for the protocols that allow two applications to speak to each other. If you are using your mobile phone and you want to log into your bank using an app, an API will send your user credential and password to your bank, and will return information about your balances and transactions. In other words, APIs are structured ways of sending requests back and fourth between systems. The provide permission for external users to query some parts of internal databases (e.g. what is my checking account balance?), and control what information will be returned.
In some cases, organizations that host public datasets have created data APIs to make it easier to request and share the data. To see some examples visit the Data Science Toolkit website, and test out some APIs. In some cases you give some search parameters (such as a zip code), and it returns a new dataset (census data). In other cases, you send data (raw text), and the API sends you a processed version of the data (a sentiment score based upon words in the text). Thus APIs can be used both to access new data sources, as well as to clean or process your current data as part of your project.
The R community has made a lot of APIs easier to use by creating packages that allow you to access data directly in R using custom functions. For example, the Twitter package allows you to request tweets from specific dates and users, and sends back a dataset of all tweets that meet your criteria (with limits on how much you can access at a time).
R packages translate the API into functions that will translate your request into the correct API format, send the request, return the data directly into R, and often convert it into an easy to use format like a data frame. In this way, you can quickly access thousands of datasets in real time through R, and you can also store your requests in scripts for future use.
For the discussion topic this week find an example of an API that could be useful for your work. For example, I use a lot of federal data. I was excited to learn that the website Data USA has created a public API that allows users to access over a dozen federal datasets:
You can find APIs through a Google search, or browse datasets on the DS4PS Open Data page. Altnernatively, you can report on a package in R that uses a data API and describe what kinds of data the package allows you to access.
Note, you do not have to show how to use the API for the post, just identify what information is accessible and how it might be used.
This week has you continue practicing “data wrangling”. This week will add the step of joining multiple datasets prior to analysis. We will continue to use the dplyr package.
Learning Objectives
By the end of this unit you will be able to:
Merge two related datasets using join functions
Identify appropriate keys for joins
Determine whether you need an inner, outer, or full join
We will join the Salaries table to player bios (Master table) and performance data (Batting and Fielding) to assess which characteristics predict salary and which teams have been able to most efficiently convert salary to wins.
Hear me out. The government is just one big open-source project.
Except currently the source code is only edited irregularly by one giant team, and they debate every single change, and then vote on it.
The code is now millions of lines long, and most of it doesn’t do what it was originally designed for, but it is too exhausting to make changes so they just leave it. There are lots of bugs, and many features do not work.
Despite the flaws, the code somehow still functions (albeit very slowly now, like really slow), and the fan is making funny noises, and sometimes we get a blue screen during the budget process and it shuts down for a few weeks. But when it is re-started, it still kinda works.
It’s an imperfect metaphor, but many people have theorized that government can learn a lot from how open source projects are managed (or governed if we are being precise).
Ben Balter wants to get all up in the U.S. government’s code, and he thinks you should be able to as well. Balter, a Washington, D.C.-based lawyer, is GitHub’s official Government Evangelist. His purpose: to educate government agencies about adopting open-source software.
My favorite Ben Balter project was something simple. GIS files are notoriously large and hard to work with (for some reason GIS shapefiles still split data into five separate files that you have to keep together for them to work properly).
The open source community has created some better data structures that are more efficient and easier to share (geoJSON files), but the geographers that work for cities were all trained on ArcGIS products so it’s all they know! Ben wrote a script that downloaded all of Washington DC’s open data files, converted them to better formats, then uploaded them to GitHub so others have access.
https://github.com/benbalter/dc-maps
It might seem trivial - but geoJSON files can be read into R directly from GitHub, making it easy to deploy the data for a wide variety of purposes:
Do you think open source frameworks would help open the black box and make government more accessible? Would government become more accessible, or alienate regular citizens that are not computer scientists? Would it make influence from special interests more transparent, or would it make it easier for them to hijack the process of shaping local laws?
“With very few exceptions, there is no shortcut between not knowing something and knowing it. There is a beauty to awkwardness, a wisdom in the wobble.”
~Maya Stein
Your Final Week
The following checklist will help you stay organized for your final week.
Since you are sharing your code-through with your classmates on Yellowdig, it will serve as your discussion topic this week.
If you send me your RMD and HTML files via email, I will post them to GitHub and create a link for you if you would like to share a URL instead of a file.
Working with the crash data from Lab-05, you will extend the work you began in Lab-04 by building on a dynamic data dashboard that will be used to explore and reveal insights in Tempe crash data.